

Dupont analys
Dupont analys
En enkel finansiell analys för att bedöma ett företags kvalitet och jämföra dess kvalitet med andra företag

Introduktion
Dupont-analysen är en finansiell ratio som mäter ett företags finansiella prestanda. Det är ett utmärkt verktyg för att jämföra företag från olika branscher. Det är också mycket användbart för att jämföra företag inom samma bransch, eftersom det ger en snabb översikt över hur ditt företag jämförs med sina konkurrenter.
Till exempel, om du är intresserad av att investera i en viss aktie och vill se hur den jämförs med andra aktier på marknaden, kan Dupont-analysen användas som ett första test av företagets kvalitet och vad det gör bättre eller sämre än sina konkurrenter.
Dupont-analysen innebär att man beräknar företagets finansiella hälsa baserat på avkastning på eget kapital (ROE), finansiell hävstång, avkastning på tillgångar, vinstmarginaler och kapitalomsättning. Tekniken kan användas för att bedöma marknadsvärdet för två eller flera företag inom samma bransch eller olika sektorer.
Dupont är en kraftfull analys eftersom den visualiserar två egenskaper som investerare utvärderar när de letar efter kvalitet i ett företag; lönsamhet och förmåga att hantera tillgångar effektivt. Båda är viktiga och kan ge vittnesmål om jämförelsefördelar gentemot andra företag.
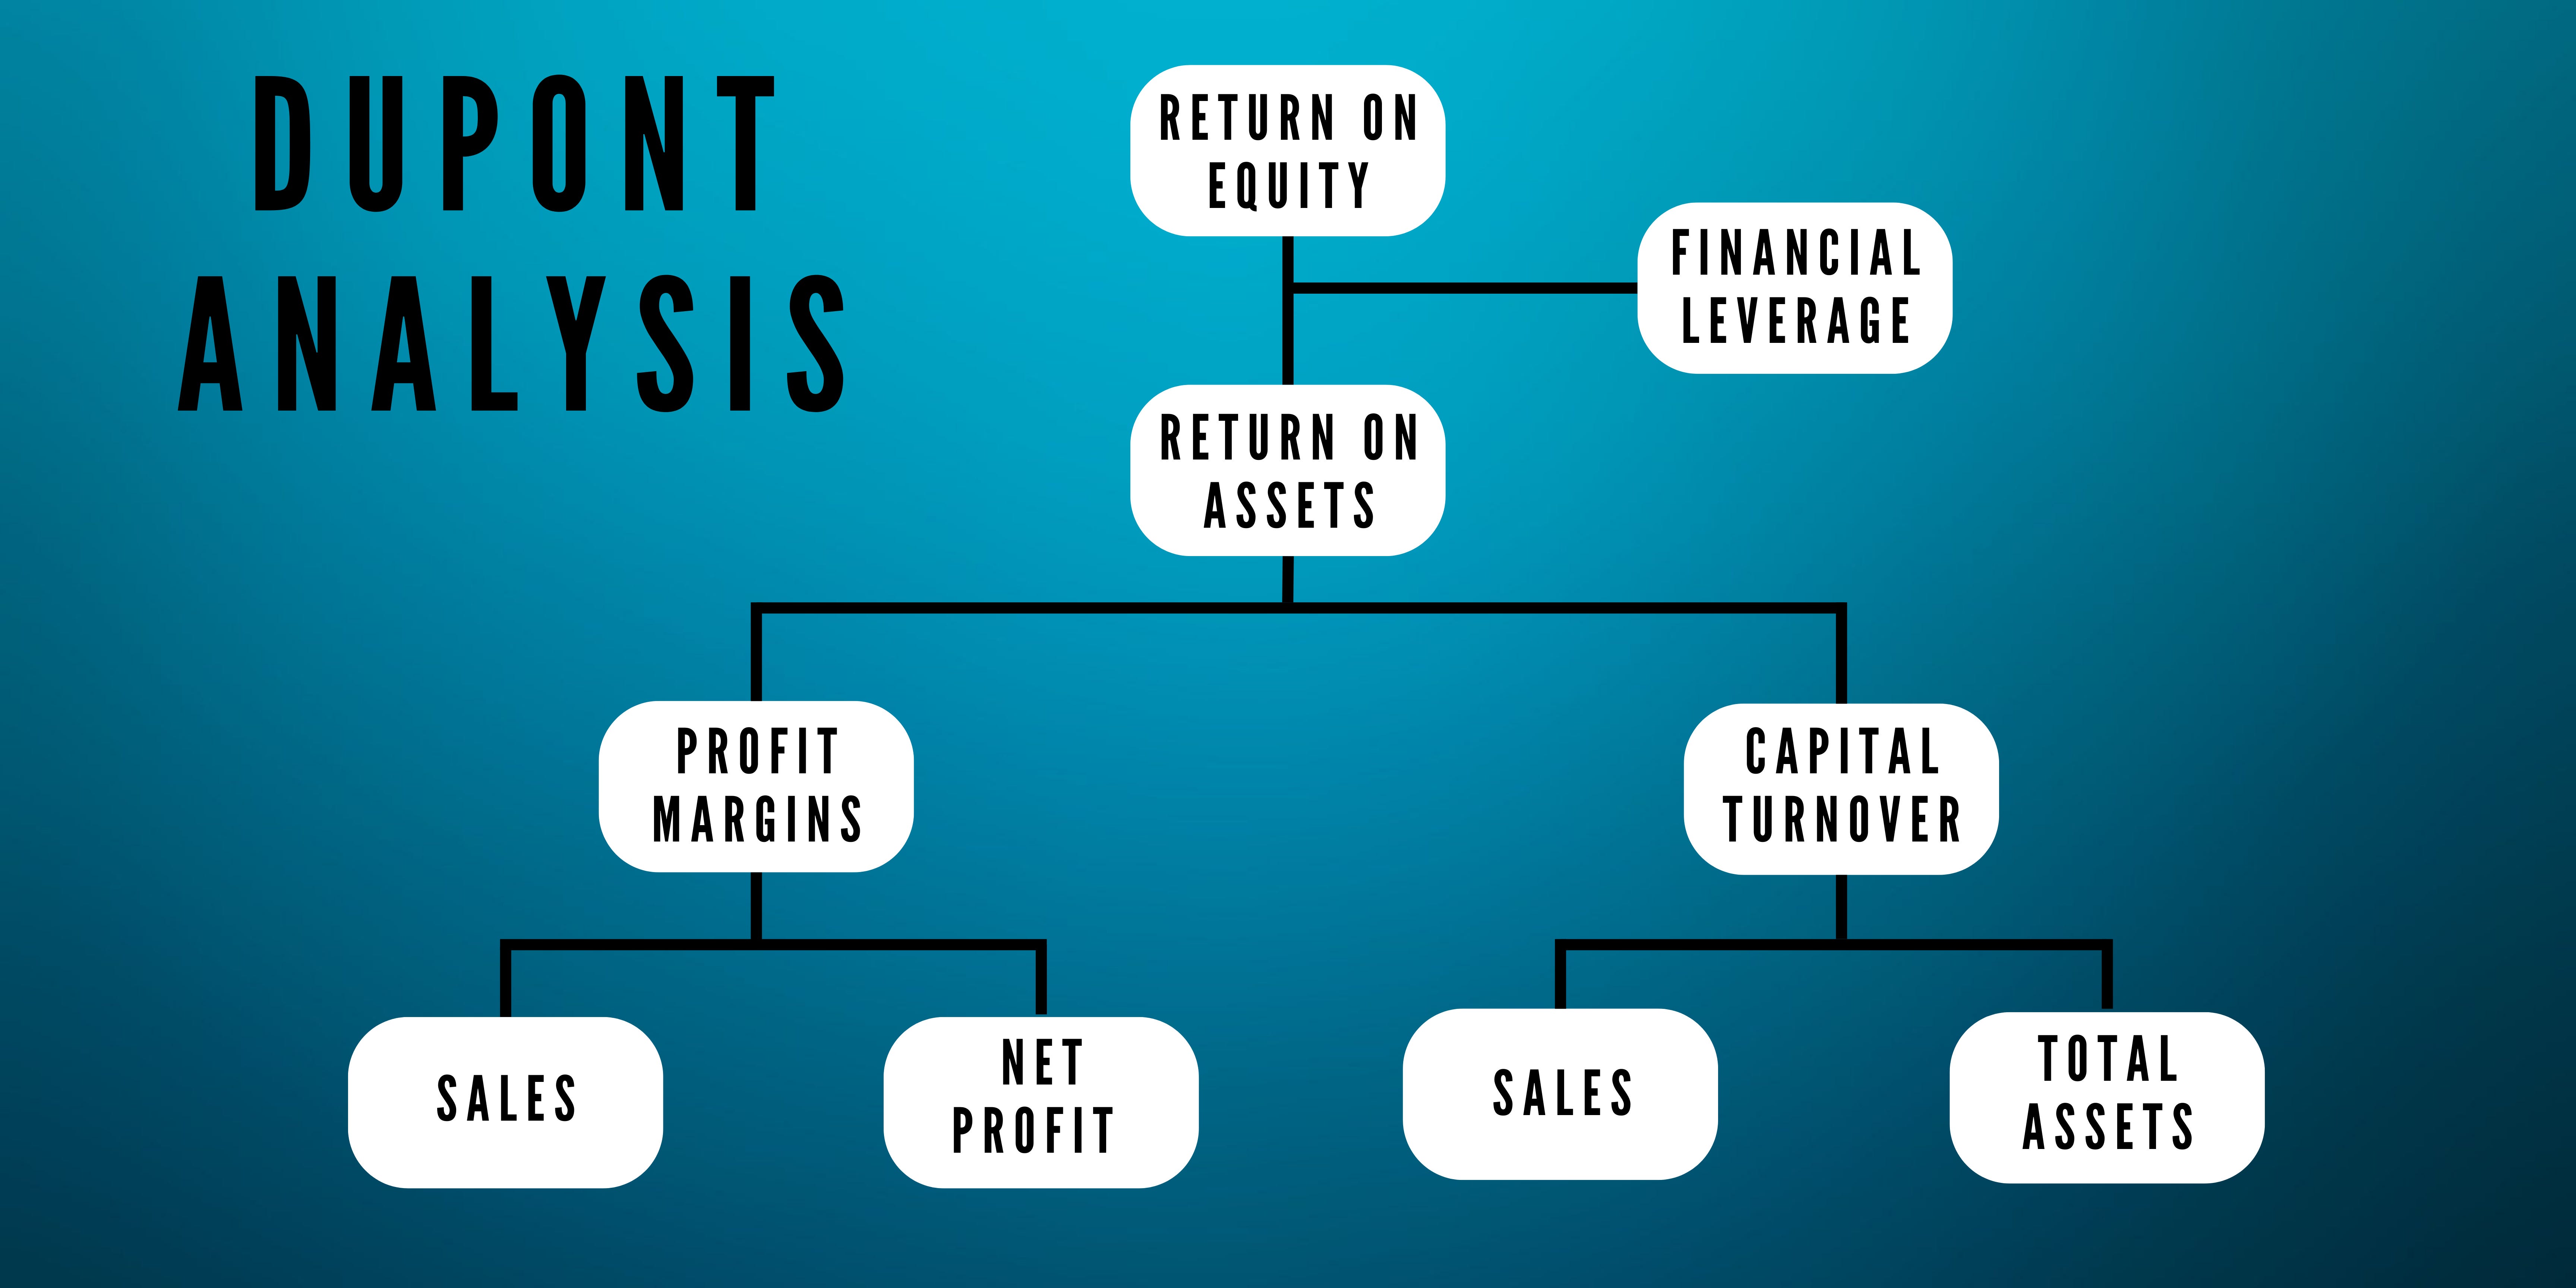
Låt mig gå igenom aktionsträdet från toppen.
Avkastning på eget kapital (ROE) = Avkastning på tillgångar * Finansiell hävstång
Finansiell hävstång = Totala tillgångar / Eget kapital
Avkastning på tillgångar (ROA) = Vinstmarginaler * Kapitalomsättning
Vinstmarginaler = Nettovinst / Försäljning
Kapitalomsättning = Försäljning / Totala tillgångar
Avkastning på eget kapital (ROE)
Avkastning på eget kapital (ROE) är ett mått på hur mycket pengar ett företags aktieägare tjänar i förhållande till det insatta kapitalet i företaget. Det beräknas som nettovinsten dividerat med eget kapital:
ROE = Nettovinst / Eget kapital
ROE kan användas för att jämföra företag inom en bransch och mellan olika branscher, men det är inte önskvärt för att jämföra privata och publika företag eftersom olika redovisningsregler gäller vid beräkning av vinst för privata jämfört med publika företag.
Finansiell hävstång
Förhållandet för finansiell hävstång är ett mått på risken förknippad med användningen av skulder. Det speglar hur mycket skulder som används för att finansiera tillgångar och beräknas genom att dela totala tillgångar med eget kapital.
Finansiell hävstång = Totala tillgångar / Eget kapital
Avkastning på tillgångar (ROA)
Avkastning på tillgångar (ROA) är ett mått på effektiviteten hos ett företags tillgångar. Denna mätning visar hur mycket vinst som genereras från varje investerad dollar i verksamheten. För att beräkna ROA, dela nettovinsten med totala tillgångar och uttryck det som en procent:
Nettovinst = Totalt intjänat belopp i företaget
Totala tillgångar = Föremål som har värde för företaget, såsom pengar, tillgångar (såsom utrustning), kundfordringar, byggnader eller mark.
ROA = Nettovinst / Totala tillgångar
Vinstmarginal
Vinstmarginalen visar hur lönsamt ett företag är genom att uttrycka hur mycket av varje intäktskrona som stannar kvar som nettovinst. Vinstmarginalen beräknas genom att dela nettovinsten med försäljningen.
Nettovinst = Totalt intjänat belopp i företaget
Försäljning = Totalt belopp av sålda varor och tjänster
Vinstmarginal = Nettovinst / Försäljning
Kapitalomsättning
Kapitalomsättning uttrycker hur många gånger kapitalet har använts i företaget. Ett företag vill ha en hög kapitalomsättning, vilket innebär att det behöver en lägre mängd kapital än ett företag med låg kapitalomsättning. Kapitalomsättning ger en indikation på hur effektivt ett företag använder sitt kapital och hur "asset-light" det är, vilket kan resultera i en fördel gentemot konkurrenterna. Om två företag (företag A och B) har samma vinstmarginaler, kommer företag A med högre kapitalomsättning att uppnå en högre avkastning på kapitalet för investerarna än företag B. Kapitalomsättning beräknas genom att dela försäljningen med totala tillgångar.
Försäljning = Totalt belopp av sålda varor och tjänster
Totala tillgångar = Föremål som har värde för företaget, såsom pengar, tillgångar (såsom utrustning), kundfordringar, byggnader eller mark.
Kapitalomsättning = Försäljning / Totala tillgångar
Dupont-analys i ett sammanhang
Michael Mauboussin och Dan Callahan, CFA, på Morgan Stanley har kommit ut med en artikel med namnet "Avkastning på investerat kapital". Det är en skattkista för alla som vill lära sig mer om investeringskapital, och om du vill lära dig mer om det bör du läsa denna artikel. Du kan hitta artikeln här.
Artikeln handlar inte om Dupont-analys, men den har en mycket insiktsfull graf över drivkrafterna i ROIC (Avkastning på investerat kapital). (Denna graf kan också användas i en Dupont-analys; du använder bara investerat kapital istället för totala tillgångar och NOPAT [Nettoresultat före skatt] marginal istället för vinstmarginal).
Här kan vi se hur vissa företag kan ha hög ROIC. Till exempel har detaljhandelns jättar Target, Walmart, Home Depot, Nike och Amazon en hög ROIC på grund av hög kapitalomsättning för investerat kapital. Samtidigt har mjukvaruföretag som Oracle, Mastercard, Microsoft, Meta, Alphabet, Qualcomm och Apple höga NOPAT marginaler.

Det är mycket intressant hur Mauboussin och Callahan också har skapat två cirklar och skrivit kostnadsledarskap och differentiering som leder tillbaka till två av de sätt som Porter såg att ett företag får en konkurrensfördel. Om du vill läsa mer om Porter och hans Power-modell hittar du min artikel här.
Slutsats
Låt oss avsluta detta inlägg genom att titta på några andra Dupont-analysanteckningar:
Först är det viktigt att komma ihåg att användningen av formeln bara är ett sätt att analysera ett företag. Det finns många andra sätt du kan göra det på, och de kommer alla att vara olika beroende på vilken information du har tillgänglig eller vilken typ av bransch du vill analysera. Själva formeln är tillräckligt flexibel för att du ska kunna anpassa den efter vad som fungerar bäst för dina behov; dock rekommenderas det att hålla sig till grunderna när du gör det!
För det andra, kom ihåg att medan Dupont-analys kan användas i många branscher och för många ändamål (som att jämföra två företag), fungerar den inte bra som ett absolut mått eftersom förhållanden som avkastning på eget kapital tenderar att variera beroende på branschtyp samt företagsstorlek. Detta innebär att om du jämför företag över olika sektorer förvänta dig inte att dessa förhållanden ska komma ut exakt lika eller ens nära varandra!