

S-kurvan

Introduktion
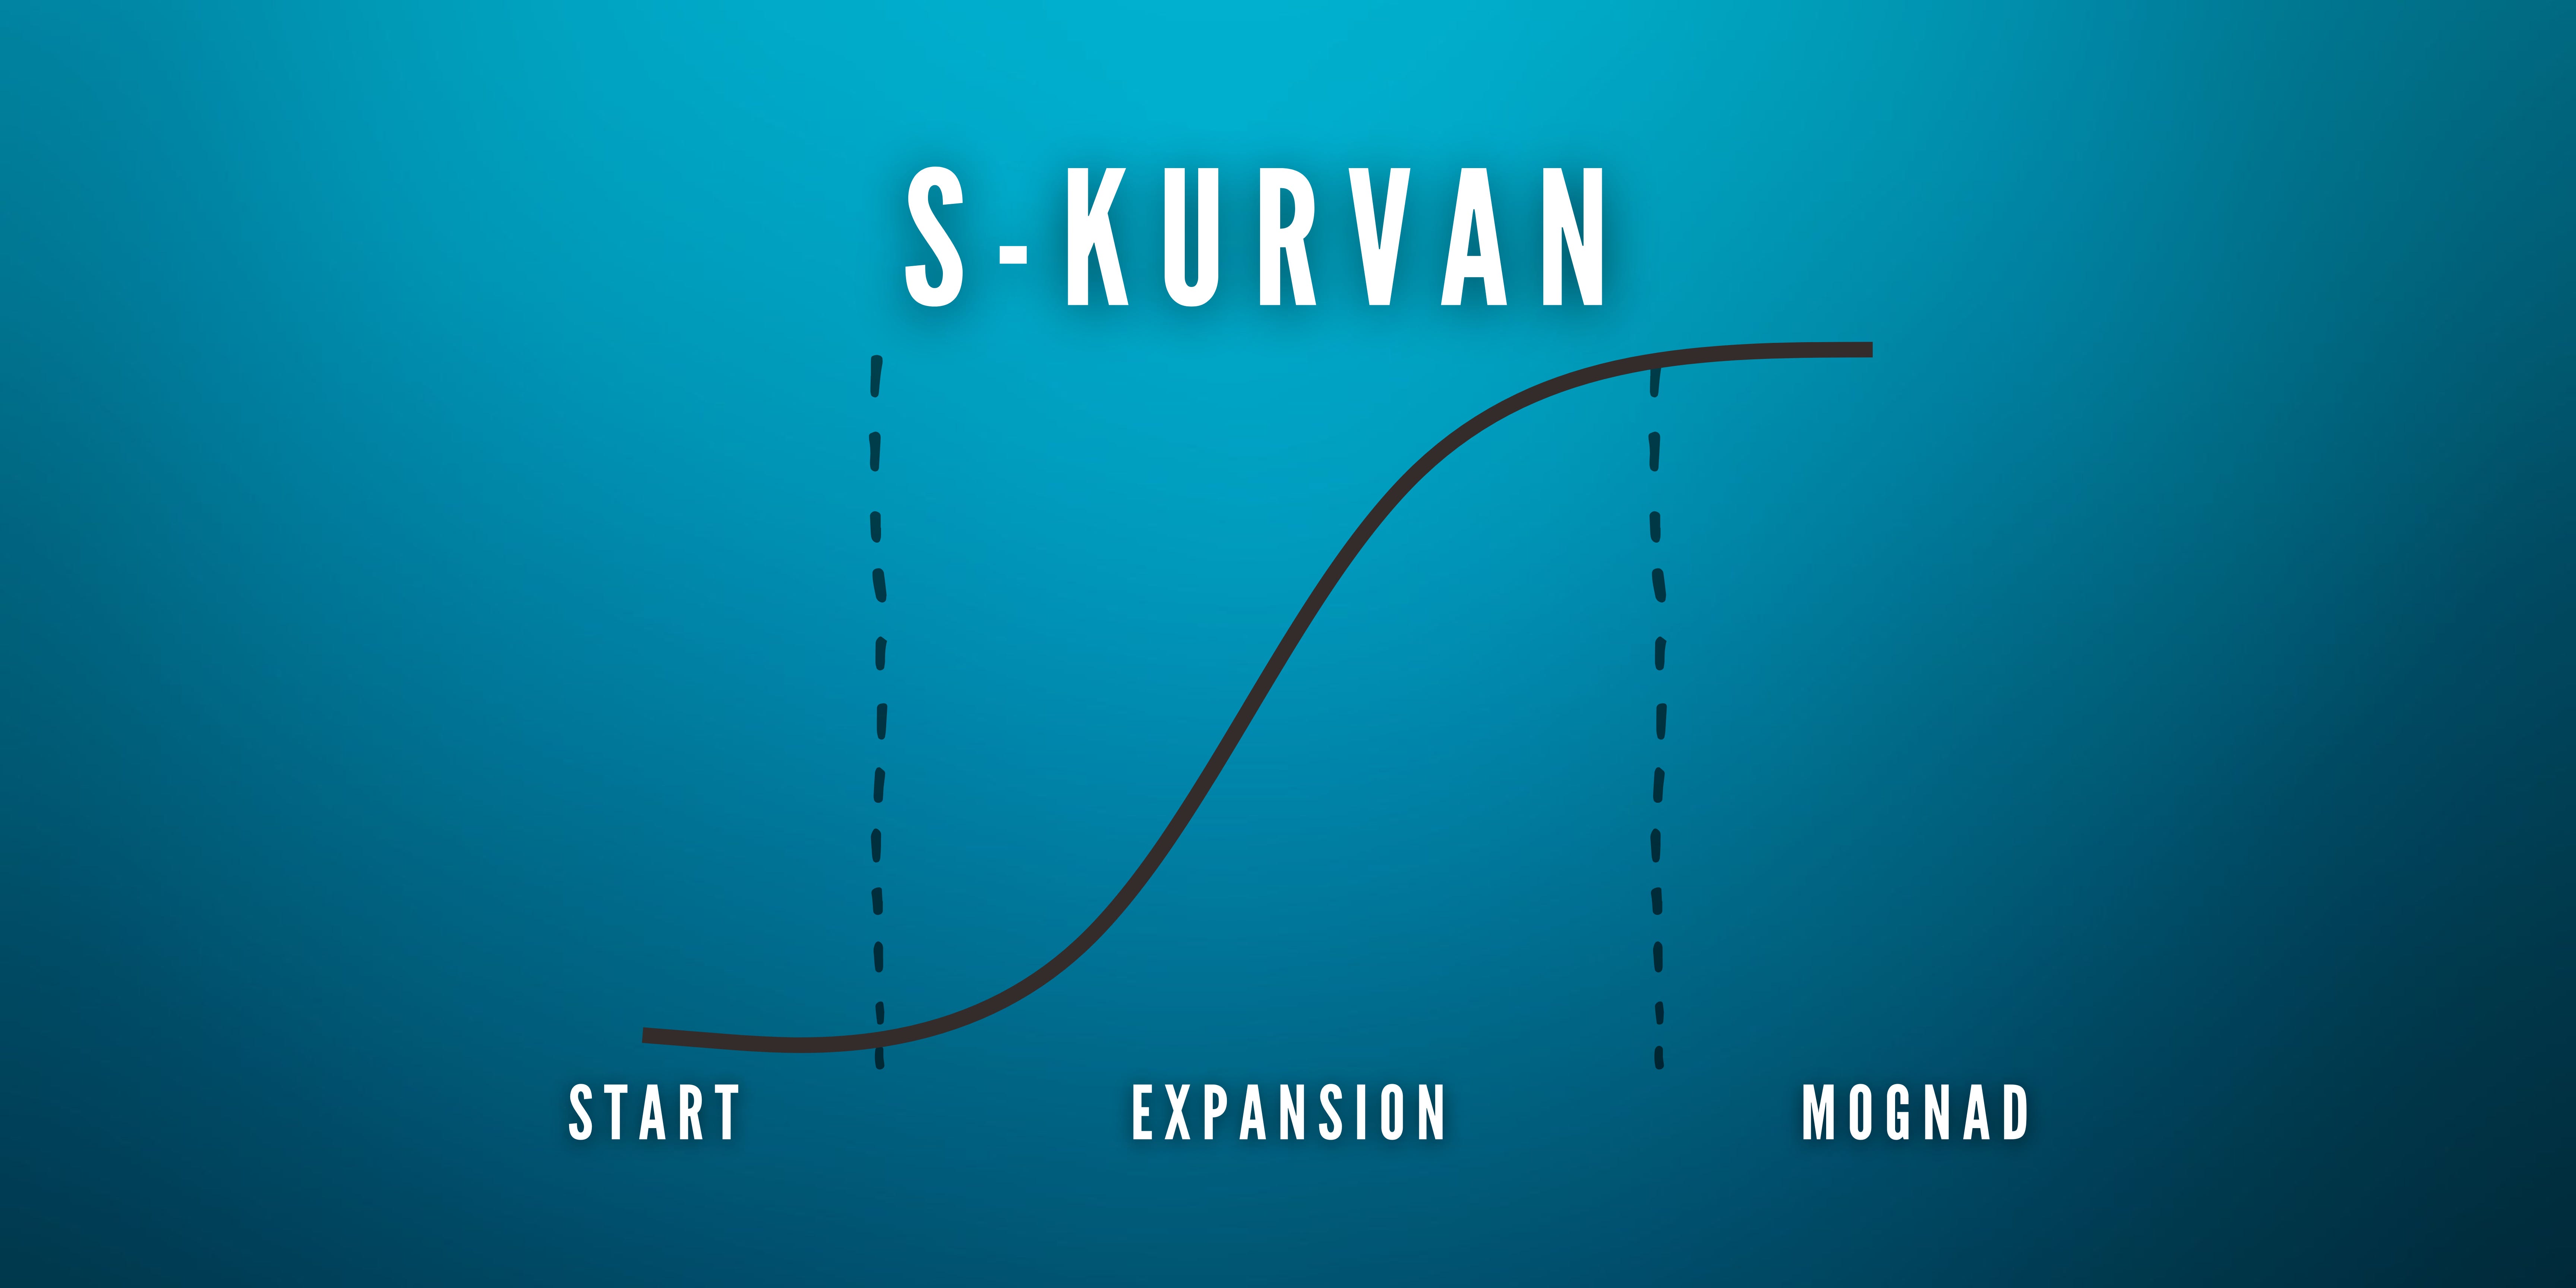
En S-kurva är en grafisk representation av produktens livscykel. Den visar produkten's tillväxt över tiden, från dess introduktion på marknaden till den når mättnad. Detta kan ses som en klockformad graf som liknar ett S när den ses ovanifrån, därav dess namn. S-kurvan kallas också för "S-formad kurva" eller "S-kurva". De tre stegen i en S-kurva är; Introduktion, Expansion och Mognad.
En feedback-kontrollprocess är ett metodiskt sätt att hantera förändringar över tid. Dessa processer låter dig förutse förändringar i din omgivning och bedöma hur de kommer att påverka din verksamhets prestanda genom att förutse var du vill hamna, sedan använda sensorer och system (som larm) längs vägen så att när något oväntat händer kan du vidta rättelseåtgärder innan det blir för allvarligt för fortsatt framgång.
S kurva
S-kurvan's form beror på många faktorer, inklusive marknadsförhållanden och konkurrens. Detta innebär att S-kurvan inte är en perfekt modell för alla företag eller marknader; det är helt enkelt ett sätt att tänka på hur ditt företag kan växa över tiden.
S-kurvan tar heller inte hänsyn till icke-linjära tillväxtmöjligheter som förvärv eller investeringar i ny teknik - men den ger ändå värdefulla insikter i hur dessa typer av aktiviteter kommer att påverka ditt företags övergripande riktning.
Produktlivscykeln (PLC)
Du har förmodligen hört talas om produktlivscykeln (PLC), men vet du vad det är? PLC är en modell som illustrerar hur en produkt rör sig genom olika faser av dess utveckling, tillväxt och mognad över tiden. Varje stadium har sina egna egenskaper som påverkar hur du bör närma dig din marknadsföringsstrategi.
Det kan vara hjälpsamt att tänka på detta i termer av S-kurvor: När en produkt först introduceras på marknaden upplever den högt intresse när konsumenter testar den och lär känna den bättre; detta kallas "infancy"-fasen. Detta initiala intresse minskar successivt när konsumenterna blir bekanta med produktens funktioner och fördelar. Till sist stabiliseras och planar efterfrågan ut (detta kallas mognad) tills det kommer en punkt där försäljningen börjar minska och slutligen upphör helt och hållet.
Håll S-kurvan levande
När produkten eller företaget når mognad behöver företaget fatta tre beslut:
Kan produkten starta en ny S-kurva? Genom att förbättra produkten eller kanske hitta en ny kundgrupp eller tillämpning.
Har produkten nått en sådan position på marknaden att försäljningen inte kommer att minska mycket och genom marknadsföringsaktiviteter kan den fortsätta att växa med låga siffror? Tänk på exempel som WD-40, en produkt som har varit liknande i årtionden.
Produkten har gått igenom en cykel av framgångar och motgångar. Den kan inte ta fart igen på grund av att den inte kan användas på nytt eller att ny teknik har kommit in på marknaden och gjort produkten överflödig. Tänk på produkter som bredbandsfiberinstallationer eller mekaniska räknemaskiner. Förhoppningsvis har företaget en produktportfölj. Annars kommer företaget att dö med sin produkt, till exempel Kodak.
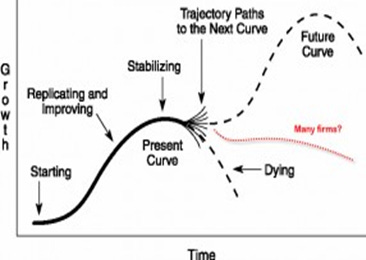
Antal sätt att uppnå en ny S-kurva
Målet för ett företag är att förlänga expansionsfasen så mycket som möjligt och när det når mognad att sedan gå in i en ny S-kurva. Några sätt att göra detta är:
Nya geografiska marknader
Nya tillämpningar
Förbättra produkten
Öka priset
Minska kvantiteten och behåll samma pris
Det är betydligt mer lönsamt att låta en befintlig produkt få en andra S-kurva än att skapa en helt ny produkt.
Hur ser en kvalitetsföretags S-kurva ut?
Den verkliga källan till kontinuerlig tillväxt är innovation, både i produkten och i användningen av produkten. Ett kvalitetsföretag innovativt sina produkter och hittar nya tillväxtmöjligheter när de gamla produkterna försvinner. Det kan vara kostsamt att hela tiden behöva innovera för att överleva. Ett kvalitetsföretags S-kurva ser ut så här, de staplas på varandra.
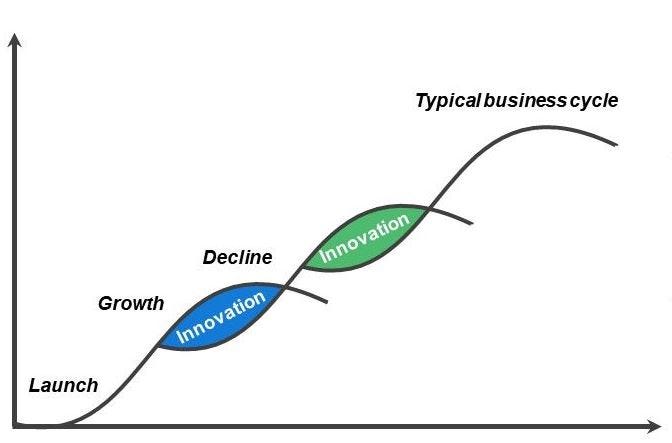
Apple är ett bra exempel på ett företag som innovativt skapar staplande S-kurvor genom att kombinera det med varumärket, där människor ser Apple-produkter som en accessoar till en livsstil – en kraftfull kombination. Vi är nu på iPhone 14, det började med iPod och Mac-datorer. Nu har vi iPhone, Apple Watch, iPad, Mac-datorer och ett antal tjänster som stöder dessa produkter. Ett tydligt tecken på innovation, eftersom det har gått igenom så många produktkategorier för att hitta nya tillväxtmöjligheter.
Hur påverkar S-kurvan en investeringsanalys?
Tja, på flera sätt. Först och främst, tänk på var företaget befinner sig på S-kurvan. Är det i sin linda, i expansionsfasen eller mognadsfasen? Eller kanske till och med före sin linda?
Alla dessa stadier kräver olika strategier för att analysera företaget. Ett företag i sin linda bör förmodligen undersökas med fokus på produktens mottagande, om människor använder den kommer den sannolikt att ha bra försäljning. Här ligger hela värdet i företaget i ledningens förmåga att monetarisera produkten och ta rätt pris för den utan att utesluta för många kunder. Tänk också på beteendet hos användarna av produkten. Om det är en engångsanvändning och högt pris måste företaget hitta nya kunder hela tiden. Å andra sidan, om det är en hög grad av upprepning och frekvens, som till exempel flaskvatten. Människor behöver dricka minst två eller tre flaskor varje dag, men då är vatten en förbrukningsvara. Så produkten kommer att ha många konkurrenter som sätter press på både marknadsföringen och prissättningen av flaskvattnet.
Låt oss säga att företaget befinner sig i expansionsfasen. Det har överlevt klyftan i adoptionskurvan och har en hög tillväxttakt. Det kanske inte är lönsamt ännu, och varför skulle det vara det? Det bör förmodligen ta marknadsandelar innan det tänker på att vara lönsamt. Vad händer då? Majoriteten av företagets värde flyttas långt in i framtiden, och terminalvärdet utgör förmodligen den största delen av det beräknade intrinsiska värdet. Vi kan tala om en expansionsfas på 15+ år, och prognoser säger att människor inte ens kan förutsäga med precision längre än 3 år framåt. Värderingsmultiplar som använder EBIT, EBITDA, FCF, intjäning och så vidare är meningslösa. P/S och EV/S kan användas när man jämför med andra liknande företag. Jag skulle säga att de två viktigaste sakerna att titta på är:
Bruttomarginal. Om den är över 50% så är det ett bra tecken på pricing power. Dock beroende på sektor.
Hur försvarsbar är marknadsandelen efter den är tagen. Kort sagt, vallgraven. (Jag rekommenderar att läsa mina artiklar om vallgravar Porters kraftmodell och Vallgrav om du vill utvärdera en vallgrav i ett bolag)
Den tredje fasen, mognadsstadiet, är det som majoriteten av all finanslitteratur fokuserar på. Som tidigare nämnts har företag tre olika utfall att satsa på. Stjärnorna, som Peter Lynch skulle kalla dem, som fortfarande kan växa trots att företagets produkter har nått mognad. Det är här du vill vara, förhoppningsvis med en växande underliggande marknad också. Och de två andra, "stagnerande" och "utdöda". Det handlar mer om traditionell värdeinvestering i dessa typer av företag. Att hitta de som har ett mot och kan fortsätta försvara sina kassaflöden. För dessa företag handlar det mer om kapitalallokering än något annat, om de kan fortsätta ha en hög avkastning på investerat kapital, då är de förmodligen en bra investering. Därför använder de amerikanska blåskapsföretagen både utdelningar och återköp för att överföra värde till sina aktieägare.
Slutsats
S-kurvan är en väl använd term inom näringslivet. Den illustrerar hur tillväxten tenderar att ske i faser: Det finns en långsam period där försäljningen ökar i långsam takt. Sedan kommer en uppgång där försäljningen ökar snabbt under en kort tid innan den återigen avtar. Det säger en hel del om företaget och hjälper en investerare att förstå vad man bör utvärdera i de olika faserna.